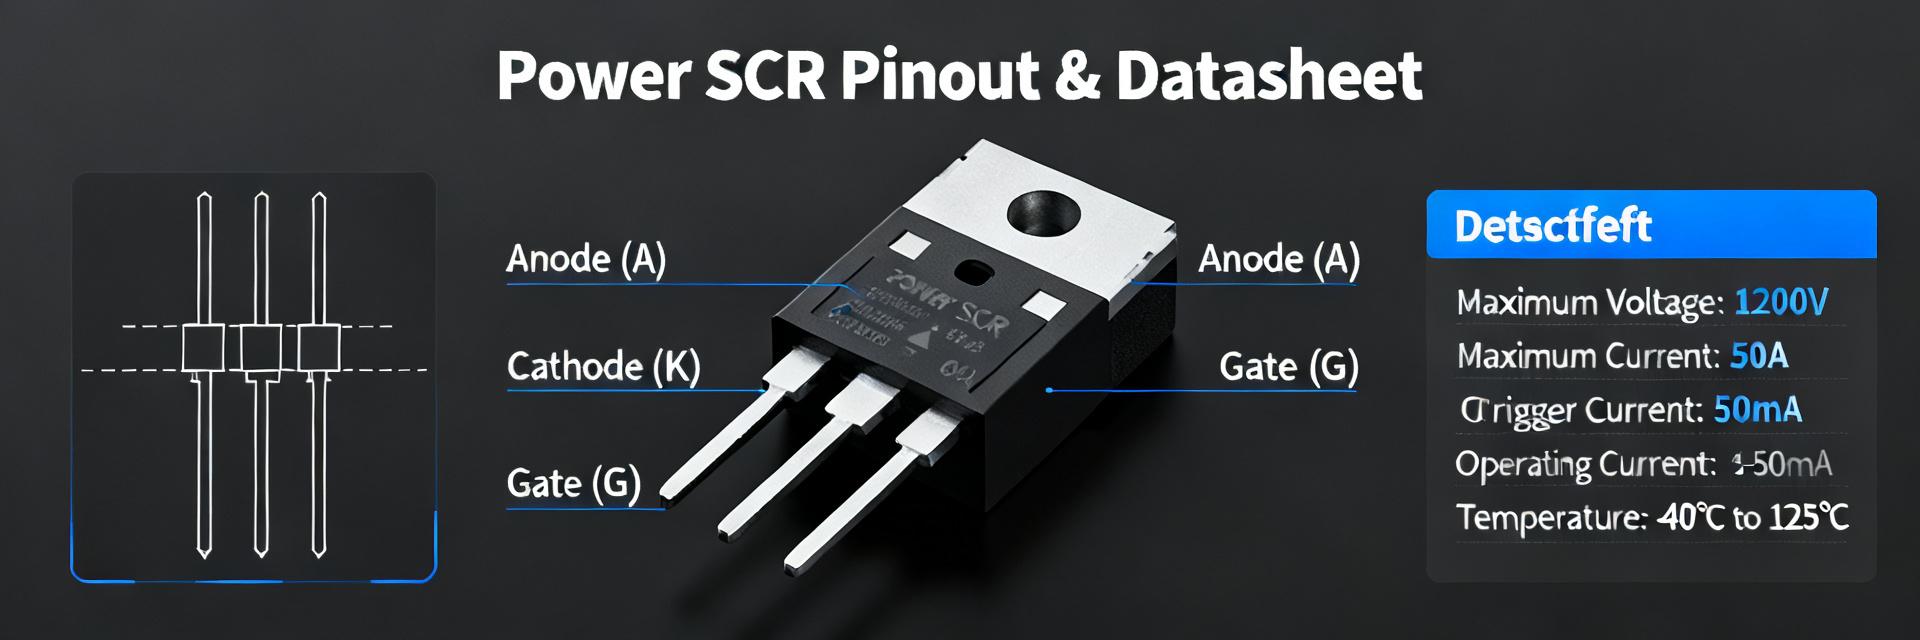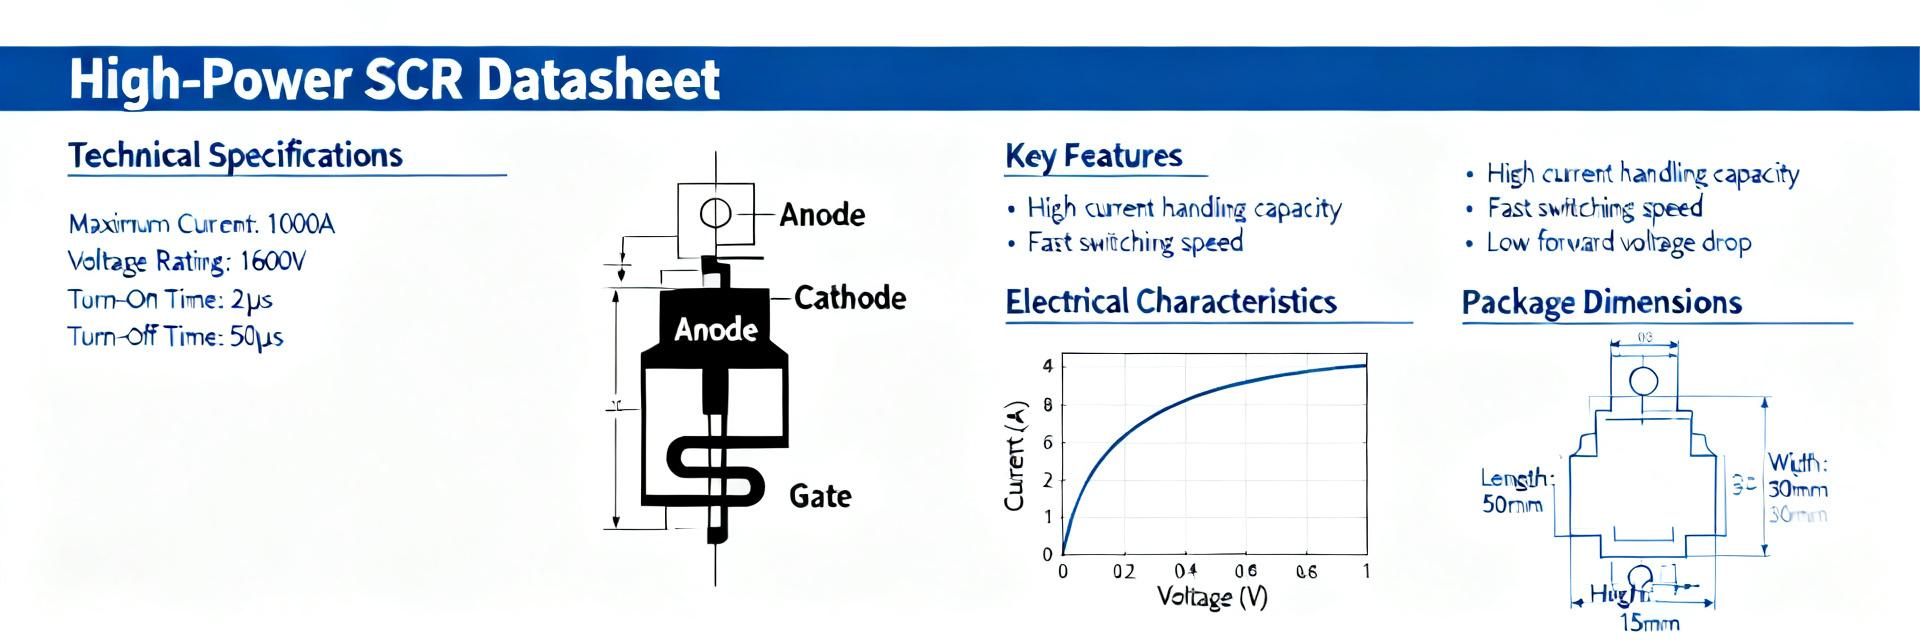
Engineers select high-power switch modules on measurable performance: on-state voltage (VTM), continuous and surge current (IT(RMS), I2t), thermal resistance (RthJC/RthCS), and switching loss. This article dissects the 10000760-1 thyristor module with reproducible test methods, expected metrics, and decision checklists so design teams can validate suitability for converters, rectifiers, and pulse-power systems.
Thyristor module performance is framed here as measurable electrical, thermal, and dynamic behavior under repeatable conditions; the following sections list required datasheet fields, static and dynamic tests, benchmarking approaches, implementation guidance, and acceptance criteria for field use.
1 — Product background & specification checklist (background introduction)
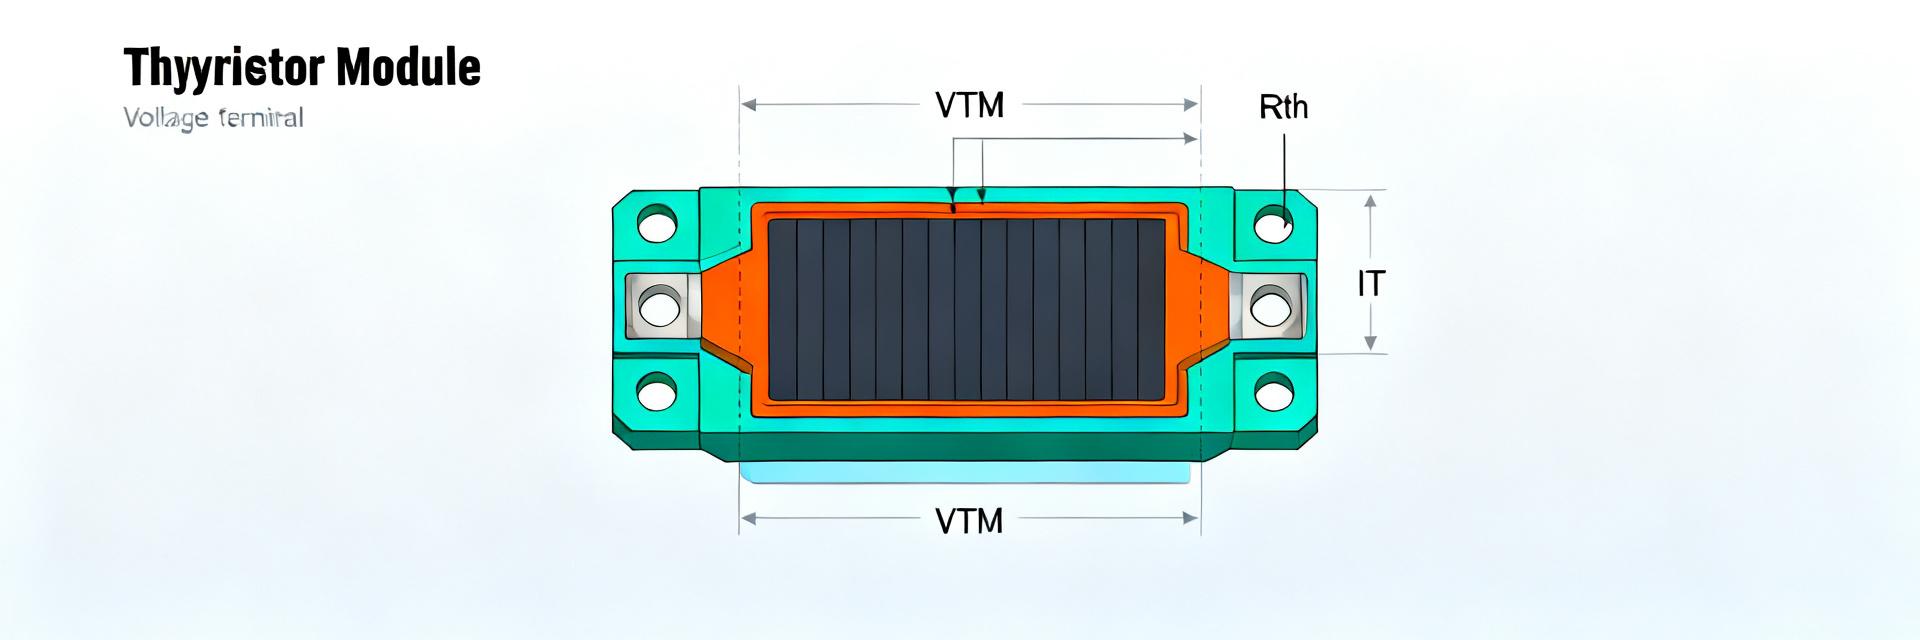
1.1 — Core electrical and mechanical specs to extract
Point: A minimal spec set is required before testing. Evidence: Datasheets typically include blocking voltage, rated currents, surge capability, VTM, leakage, thermal resistances, and gate parameters. Explanation: Collecting these fields ensures test coverage and traceability when comparing measured results to vendor claims.
| Field | Typical Entry | Notes |
|---|---|---|
| Rated blocking voltage (VDRM/VRRM) | — | DC repetitive max |
| Repetitive RMS current (IT(RMS)) | — | Cooling and mounting dependent |
| Surge I2t / Isurge | — | Single-pulse spec |
| On-state VTM vs. IT | — | Provide curve or points |
| Leakage (IT at V and T) | — | Specify temp |
| RthJC / RthCS | — | Measurement method noted |
| Gate trigger current/voltage | — | Conditioned vs. temp |
| Package footprint & thermal interface | — | Mount torque and TIM |
1.2 — Typical applications & intended operating envelopes
Point: Map specs to use cases. Evidence: Modules of this class support phase-controlled rectifiers, DC drives, inrush limitation, and traction rectifiers. Explanation: Duty cycle, expected ambient, and required surge tolerance determine whether the module meets application constraints; list expected ambient range and cycle patterns before selection.
- Phase-controlled rectifier: continuous IT(RMS) with conservative derating and snubbering.
- Pulse-power/commutation: prioritize I2t and di/dt capability.
- Traction/industrial drives: robust thermal management and monitoring required.
2 — Measured performance metrics: static & steady-state (data analysis)
2.1 — Static/steady-state metrics to report (what to measure and why)
Point: Core steady-state metrics include VTM vs. IT, leakage vs. V and temperature, IT(RMS) thermal limits, and Rth measurements. Evidence: Measured VTM curve and RthJC allow conduction loss and thermal budget calculations. Explanation: Report each metric with test condition, measured value, unit, and uncertainty to allow reproducibility and comparison.
| Metric | Test condition | Measured value | Unit | Uncertainty |
|---|---|---|---|---|
| VTM @ specified IT | e.g., 100 A DC, case 25°C | — | V | ±X% |
| IT(RMS) | Forced-air, specified case temp | — | A | ±Y% |
| Leakage vs T | V=VDRM, multiple T | — | A | — |
| RthJC | Steady-state, calibrated sensors | — | °C/W | ±Z% |
Suggested visuals: Figure 1 VTM vs IT curve, Figure 2 leakage vs temperature. Include axis labels, test current waveform, case temperature, and sample size in captions.
2.2 — Thermal performance and derating curves
Point: Thermal limits set continuous current. Evidence: Measured RthJC and mounting thermal resistance define junction temperature rise per watt. Explanation: Generate derating curves (allowed IT(RMS) vs ambient) using Rth and a thermal budget to show required cooling for target junction temperature.
| Ambient (°C) | Allowed IT(RMS) (A) |
|---|---|
| 25 | Example: 150 |
| 35 | Example: 120 |
| 50 | Example: 85 |
3 — Dynamic & switching metrics and test methodology (method guide)
3.1 — Dynamic metrics to capture (di/dt, dv/dt, turn-on/off behavior, switching energy)
Point: Capture di/dt, dv/dt limits, switching energy per event, and commutation behavior. Evidence: Oscilloscope waveforms of current ramp, V across module, and gate drive reveal overshoot and delay. Explanation: Use low-inductance probing, differential voltage probes, and calibrated Rogowski or current probes; document probe placement to avoid artifacts and include sample waveform captions (current ramp, VTM transient, gate pulse).
Figure captions: Figure 3 — Turn-on current ramp and V across module; Figure 4 — Switching energy measurement window and integration limits.
3.2 — Recommended test setups and standardized conditions
Point: Repeatability requires standardized fixtures. Evidence: Clamped inductive tests and resistive loads with defined gate drive, fixture inductance, and ambient conditions produce comparable results. Explanation: Provide a step-by-step checklist: fixture prep, probe calibration, gate drive waveform, temperature stabilization, sample size and averaging; note measurement uncertainty sources and mitigation (ground loops, probe bandwidth).
- Define load (resistive/clamped inductive) and fixture L.
- Specify gate drive amplitude and rise time.
- Stabilize case temperature; measure Rth conditions.
- Capture ≥5 events, average, report variance.
4 — Comparative benchmarks & real-world use cases (case study + data analysis)
4.1 — How to benchmark (normalize metrics & present comparisons)
Point: Normalize to package area, thermal mass, or rated voltage for fair comparison. Evidence: Normalized columns such as VDRM, IT(RMS), VTM@X A, RthJC, and switching loss allow trade-off charts. Explanation: Present results per mm² of active area or per watt of thermal mass, and plot efficiency vs. ruggedness to guide trade-off decisions.
| Normalization | Column examples |
|---|---|
| Per active area | VTM/A, IT(RMS)/mm² |
| Per package thermal mass | Allowed power dissipation per oz |
4.2 — Two short application examples with performance interpretation
Point: Apply measured metrics to real cases. Evidence: Example A — continuous rectifier demands low VTM and good RthJC; Example B — pulse application prioritizes I2t and di/dt limits. Explanation: For rectifier, size heat sink by thermal budget; for pulse, check surge table and add snubber/soft-start to protect against di/dt-induced failures. Provide decision checklist: required VTM, thermal margin, and protection needs.
5 — Implementation, protection, and reliability metrics (action recommendations)
5.1 — Thermal management, mounting, and lifetime considerations
Point: Correct mounting and TIM determine real-world thermal performance. Evidence: Torque spec, flatness, and TIM conductivity affect RthCS; cyclic junction temperature drives solder fatigue. Explanation: Use specified torque, verified TIM thickness, and thermal cycling limits to estimate maintenance intervals and lifetime; include simple thermal calculation to size heat sink.
- Mounting checklist: surface flatness, torque steps, TIM selection, verify contact resistance.
- Maintenance: periodic case temp logging and visual inspection every defined operational hours.
5.2 — Protection, monitoring, and acceptance criteria for field use
Point: Protections reduce failures and provide acceptance criteria. Evidence: Combine snubbers, RC damping, MOVs, and current limiting with case-temp and current monitoring. Explanation: Define pass/fail for incoming inspection (e.g., leakage threshold, VTM drift under specified test) and periodic checks; provide a compact protection block layout and a pass/fail table for quick acceptance.
| Test | Pass | Fail |
|---|---|---|
| Leakage at VDRM, 25°C | < specified μA | > specified μA |
| VTM @ test current | Within datasheet tolerance | Exceeds by >X% |
Summary
- Validate the 10000760-1 thyristor module against VTM, IT(RMS), I2t and Rth targets before selection; use provided tables to capture datasheet vs measured values for traceability.
- Run standardized steady-state and dynamic tests (VTM vs IT, leakage vs T, RthJC, di/dt and switching energy) with documented probe setup to ensure reproducible thyristor module performance data.
- Derate continuous current using measured Rth and mounting conditions; implement snubbers and monitoring per the protection checklist to meet field reliability goals.
FAQ — Common questions on 10000760-1 module testing
What steady-state metrics are essential when testing the 10000760-1?
Measure VTM vs. current, IT(RMS) under specified cooling, leakage versus voltage and temperature, and RthJC/RthCS using steady thermal conditions. Report test conditions, measurement uncertainty, and sample size so engineers can compare measured values to datasheet claims and reproduce results reliably.
How should switching loss and di/dt be measured for thyristor module performance?
Use a clamped inductive or defined resistive test with calibrated current probes and differential voltage probes. Capture turn-on and commutation waveforms, integrate energy over the switching window, average multiple events, and report probe setup and fixture inductance to avoid waveform artifacts.
What are acceptable acceptance criteria for incoming inspection of thyristor modules?
Set pass/fail thresholds for leakage at VDRM, allowable VTM deviation at a reference current, and visual inspection for mounting surfaces. Include thermal contact resistance checks and perform sample switching tests to detect assembly or handling damage prior to system integration.
Why is thermal derating critical for the 10000760-1 module?
Thermal limits set continuous current capability. Measured RthJC and mounting thermal resistance define junction temperature rise per watt. Derating curves must be generated using these values and ambient temperature data to ensure the junction temperature stays within safe operating areas during operation.